
Hi, I'm Paul Sesink Clee.
I'm the Deputy Geographic Information Officer for the City of Philadelphia and like creating maps and performing geospatial analyses to help illustrate stories and display data in ways that make it simple to understand.
I use various mapping platforms, Python, and R to automate analyses of big (and small) data. When not making maps, I'm often taking photos.
See some recent things that I've worked on below and find me on LinkedIn, ResearchGate, or Github.
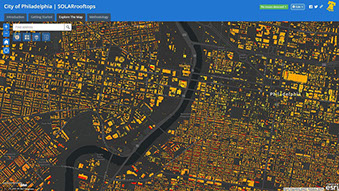
The Office of Sustainability's Energy Office wanted to create an application for citizens to see how suitable their rooftops are for solar panel installations. I used LiDAR imagery to calculate the amount of solar irradiance across all of Philadelphia County using average paths of the sun for each month of the year while taking into account the shadows that are cast by buildings and land features. The final product was a map showing solar energy by kilowatt-hour that I clipped and summarized by building footprints to show an estimate of how much solar energy could be collected when panels are installed in the most optimal positions and locations on each rooftop.
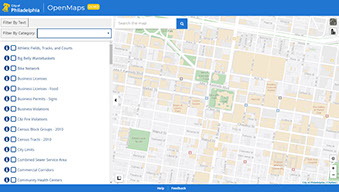
The City of Philadelphia releases a variety of open datasets on OpenDataPhilly, including a number that are spatially enabled. OpenMaps provides the public with a simple application to explore a selection of open datasets from the City of Philadelphia. All layers provide easy access to the metadata with links to endpoints where you can download the data. This application was built using a webmap backend and using the in-house created Mapboard platform.
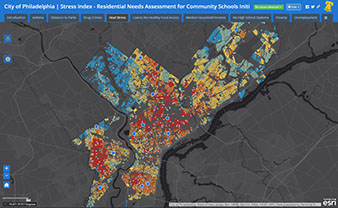
One of my first projects at the City of Philadelphia was the Stress Index. This storymap was created to display the results of an analysis including different potential stressors at a residential parcel level to help people understand the complex pressures on different neighborhoods in Philadelphia. I collected data from the American Community Survey, Philadelphia Police Department, the Center for Disease Control, and school districts to ultimately create a combined stress index. Using this applications you can explore datasets like asthma, distance to parks, drug crimes, heat stress, education levels, and poverty across Philadelphia. This tool has been used for the Community Schools Initiative to identify priority schools across Philadelphia to act as neighborhood resource centers.
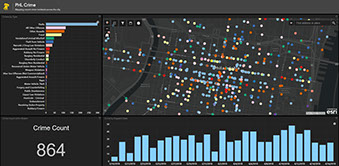
This is a quick test of ESRI's dashboard theme using Philadelphia crime incidents data (available on OpenDataPhilly) from the Police department that is updated daily. Although this data is also available on OpenMaps, this application has added summary statistics and the ability to filter crime incidents by the time they occurred (in the last 30, 14, 7, and 3 days) or by category of crime. All infographics update in real time to summarize the crimes visible in the map while panning to different areas.
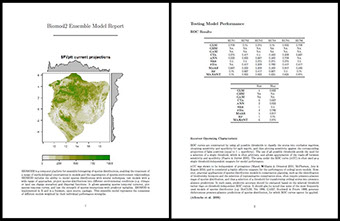
In graduate school, I focused on using distribution modeling algorithms to predict the occurrence of wildlife and wildlife infectious diseases across large geographical ranges under both current climate and future climate scenarios (see my publications here). I wrote a suite of R scripts to use in conjunction with the biomod2 distribution modeling package to simplify it's use and generate a report with additional summary statistics and simple maps using Rmarkdown. More info here.